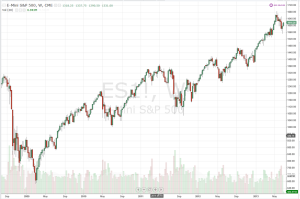
Where did the up trend begin in this chart?
We can all look at that and see that price is in an uptrend, but when exactly did you know it was in an up trend? If you cannot pinpoint the specific bar at which you determined “now we are in an uptrend,” then your method of determining the trend is useless in real time.
I have seen three (well, four, technically) definitions for how to determine a trend:
1) a series of HH/HL. Depending on who you talk to, the number of points required varies, but it’s generally at least one HH/HL to determine an uptrend.
2) the slope of an MA. This one is pretty self-explanitory although obviously results may differ based on the length of MA used.
3) S becoming R (or vice versa). This one works great when it works, but often price rallies upward for a long time without ever bouncing off of a previous R point, in which case this method would not identify the trend.
4) indicator stuff. The slope of an indicator, or an indicator crossing a certain level, or a fast line crossing over a slow line, etc. I don’t really count this as a separate category though because all indicators like these are just showing you what price is doing now compared to what it did a certain number of bars ago. They aren’t providing new information.
Those are the three (four) methods I’ve seen.
To determine a trend in real time you have to be able to reach a point in real time when you say “now that this most recent bar (or tick) has printed, a new trend has been established. Prior to this current bar (or tick) printing, the trend was either the opposite direction or unknown (chop).”
If you cannot make that statement, or if the person who is supposedly teaching you how to trade cannot make that statement, then your “trend analysis” is useless. Anyone can look at a historical chart and determine the trend, but that’s not going to help you trade today.
Also, once you determine the trend, what makes price more likely to keep going in that direction? People love to say things like “the trend is your friend until the end.” Well looking at a chart in hindsight, of course you can see big trends and areas of congestion. But let’s say you have now determined the direction of the trend because you have a method of quantifying the trend that allows you to say “as of right now I have established that we are in an uptrend whereas prior to right now the trend was either going in the other direction or price was chopping.” After you determine the trend, what makes price more likely to keep going in the current direction? How do you know you aren’t buying the top?
It is quite possible that there is no such thing as a “trend” in real time and they only exist in hindsight.
So once the trend is established, the next point becomes determining when to enter. And that’s another topic for another day.


