Silver Reversed Exactly At A Fibonacci Level!

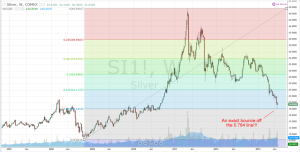
Look at this one!  Price reversed exactly at the 0.764 Fibonacci level!  Now, I didn’t even know that was a Fibonacci level, but it seems to have called the exact bottom.

silver fibonacci reversal
Unfortunately I don’t think anyone knew ahead of time that this particular Fibonacci level would be the one where price reversed (why here and not 0.618, or 0.5, or 0.382?), and I’m sure none of the fib “gurus” that people actually pay money to to learn how to trade made this prediction.

It’s funny how Fibonacci lines only seem to work sometimes and no one knows ahead of time which one will work.

It’s almost as if Fibonacci levels in trading are complete nonsense.

All Trading Is Predicting

A lot of people online, and I don’t mean just the “gurus,” get their jimmies rustled when you imply that trading is predicting.

They will say stuff like “I don’t predict, I react.”

Or, “I don’t predict, I trade based on statistical analysis of the markets.”

Or “I am playing the odds.”

Let’s cut the nonsense, it’s all the same thing.

What is a prediction?  A prediction is when you think that one thing is more likely to happen than another thing.

Why do you take a long position?  You do so because you think price is going to go up.  After all, if you thought price was going to go down, why would you take a long position?  You wouldn’t.

It doesn’t matter if you take a long position because you are “reacting” to something that makes you think price is more likely to rise, or because your “statistical analysis of the markets” suggests that in a certain scenario price is more likely to rise, you are still predicting that price is going to rise, and as a result you take a long position.

People don’t like to use the word “predict” because it ties into their ego.  If they get a trade wrong, their ego takes a blow.  Their prediction didn’t come true.  That hurts.

But when they’re “just playing the odds” or whatever, it’s ok to have some losing trades.

All trading is predicting.  Regardless of your reason for entering with a long position, whether it’s because you see a particular pattern, or you did statistical analysis, or your indicator gave a signal, or because you are “reacting” to a certain situation which has lead you to believe that price is more likely to go up than to go down, what do all of those situations have in common?

They all involve you thinking price is more likely to go up than to go down.

They all involve you predicting that price is more likely to go up than to go down.

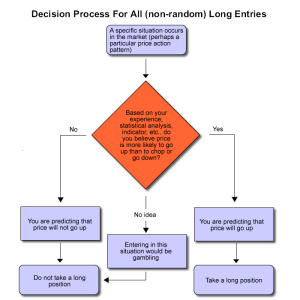
Here is a flow chart that explains the process for every single non-random long entry (random entries are not predictions; see the paragraph about random entries below):
long flow chart

(click to enlarge)
This is how every non-random long entry is made by every directional trader.

As you know, I frequently state that I cannot predict price direction, and that is why I trade the way I do.  But even when I trade I am still predicting!  I am predicting that the S&P will eventually go back up.  I don’t know when, and I don’t know how far up it will go, but I am predicting that it will eventually go back up, and that’s why I average into my positions.

If I did not believe that the S&P was eventually going to go back up, I would not take a long position.

All trading is predicting.  The reasons don’t matter.  When you take a long position you are predicting that price is going to go up (after all, if you didn’t think price was going to go up, why would you go long?).  When you take a short position you are predicting that price is going to go down (after all, if you didn’t think price was going to go down, why would you go short?).

Even if you use statistics you are still predicting.  If you are going to flip a fair coin 100 times I will predict that you will get heads 50 times.  If you are going to roll a six-sided die 60 times, I predict that you will roll a five 10 times.

If my statistical analysis tells me price is more likely to go up than to go down, I predict it will go up.  If my statistical analysis tells me price is more likely to go down than to go up, I predict it will go down.

As for “reacting,” that’s the same thing, too.  Trading “gurus” love to say they “react” rather than “predict,” as if you can’t be wrong with a “reaction.”  But even that is all the same.

We’ve already established what a prediction is: a prediction is when you feel that one thing is more likely to happen than another thing.

When a trader “reacts,” what is happening?  He sees a situation and feels that because of that situation, price is more likely to do one thing than to do something else.  In other words, he is predicting that price is going to do something, and taking the appropriate position.

A “reaction” is a prediction of what will happen now.  All predictions are reactions to the current situation.

The only way trading is not predicting is if your entries and your direction are random.  If you flip a coin and heads means go long and tails means go short, that is the only situation in which trading is not predicting because you are entering randomly rather than because you think one outcome is more likely than another.

All (non-random) trading is predicting.

Hopefully your jimmies are unrustled now.Rustled Jimmies

Weekly Silver Fibonacci

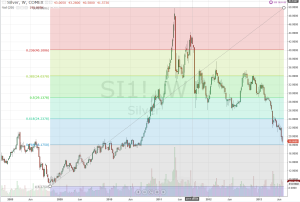
The people who think Fibonacci levels have magic powers might be interested in seeing this weekly silver chart that shows that price is just about to hit the 0.764 level.  That’s not even one of the main Fibonacci levels.  Also notice how price pretty much ignored all the other levels on the way down.

It’s funny how Fibonacci numbers only seem to work sometimes and no one can ever predict ahead of time when that will be.

silver fibonacci

There’s No Such Thing As A “Trend”

How many times have you heard “the trend is your friend”?

Ask 10 traders how they define the trend and you’ll get 10 different answers.  Let’s go over some of the common ones:

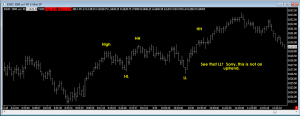
1) The trend is a series of HHs and HLs.  Really?  How many?  What if there’s a LL somewhere in there?  That happens all the time.  It also assumes that if there are HHs and HLs that price will continue to keep making HLs.

not an uptrend

Not an uptrend


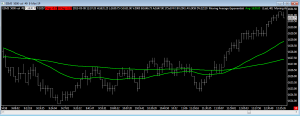
2) The trend is determined by the slope of a moving average.  Sometimes you will also hear this as “the trend is determined based on whether price is above or below a MA.”  These are the same thing because with almost every time of MA, if price is above it then the moving average is going up, and if price is below it than the moving average is going down.  The only exceptions to this are some of the stranger moving averages that use weird calculations and also sometimes you might get a calculation error depending on the software you use if there is not enough data (like if you  scroll all the way to the left of your chart), but this is all beside the point.  In any of these cases, the “trend” will then be based on the moving average type and period you chose.  Some people think a 20 period EMA (exponential moving average) is significant.  Some people think a 200 period SMA (simple moving average) is significant.  But your 200 SMA might be going up and the 20 EMA might be going down.  Then were is your trend?

wheres the trend

Where’s the trend?

3) Based on some indicator.  Don’t even get me started on this one.

Trends only exist in hindsight.  You can look at a chart and tell if price was trending up, trending down, or chopping.  But in real time you cannot tell.  How do you know where the trend begins?  How do you know that once you say “ok, we’re in a trend now” price isn’t going to immediately reverse and go back down the opposite way?

big uptrend

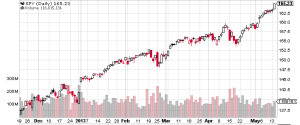
This is obviously an uptrend but we only know that in hindsight.

Check out that chart of SPY.  It’s obviously an uptrend, but did you know in March that it was going to keep going up?  What about now?  Is it going to keep going up?  It’s in an uptrend so it should keep going up, right?

Have you ever met a profitable trend trader?  I’ve seen lots of people selling courses and books about trading with the trend but I’ve never seen any of them make real time calls and be profitable.

Sometimes people will try to apply the laws of physics to the market.  You’ve heard the saying that “an object in motion remains in motion, and at a constant velocity, unless acted upon by a force.”  They’ll use that same saying to try and explain why trends exist in the market.  lol.  I mean, I guess a change in supply and demand could be “a force” that will change the motion of the market, but without knowing when that will happen, it doesn’t do us any good.  Look at that SPY chart again.  It’s been going up for a while.  Is it going to keep going up?  When is that force going to come?  I have no idea.  Neither does anyone else.

A “trend” can only be a real thing if a) you can define it, for example “one bar ago we were not in a trend but because price did a certain thing, as of this current bar we are now in a trend,” and b) that actually has any significance on its future behavior, for example, “because price is now in a trend (although it wasn’t one bar ago), it will now continue to go in the same direction.”

If you can define a trend in real time and use that to trade profitably, then keep on doing what you’re doing.

Stopping When You Hit A Weekly Goal?

Nonsense. “Stopping when you hit a weekly goal” is a psychological game that is actually detrimental to your success.

How do you know that the remaining days in the week will be losers if the previous days in the week were winners?

Winning and losing days are randomly distributed. You could have a string of winners or losers in a row and there’s no way to know ahead of time. Therefore you don’t know ahead of time if it’s going to be a winner or a loser, and therefore there’s no reason to stop trading when you hit a “weekly goal” unless you just don’t feel like trading anymore.

What if you make $1,000 by Wednesday. How do you know you would lose it all on Thursday? How do you know you wouldn’t make $2,000 on Thursday? You don’t. If you do, I would like to invest a significant amount of money with you.

Unless you have some way to know if your future trades are going to be winners or losers, then how do you know if you’re going to “lose everything you gained”?

Look, there are 5 days in a week. You have no idea which days are going to be winners and which days are going to be losers. there’s nothing magical about starting on Monday and stopping on Friday. Trade the days you want. You have the same chance of making money on any day that you trade as you do on any other day you trade. There’s no “stopping when you hit a weekly profit level.” Trade whenever you feel like trading.

More BS From The Gurus

Fib gurus will post after the fact charts. In one of them, price retraces to 38% and they say “look! Price retraced to 38% and we bought there!!!” In another one, price retraced to 50% and they will say “look, price retraced to 50% and we bought there!”

My whole point is that ahead of time, they had NO IDEA where it was going to go. On the second chart, they didn’t know that it was going to go past 38% down to 50%. And on the first chart, they had no idea it was going to reverse at 38% and not go down to 50%.

I don’t know if it is going to reverse at 38%, or 50%, or 62%… or 27.5%, or 36.349287%, or 95.11111%, or anywhere else.

I do average down starting at 38% down to 68%.


Avoiding Scammy Gurus

Fibs are dumb and so are the doublespeaking gurus who teach them. There is no logic behind suggesting that they get applied to the finacial markets.

That being said, this thread demonstrates the only way to trade with fibonacci lines in a straight forward manner. There are no BS excuses, no double speak, no after-the-fact BS explanations of why price reversed at one of the lines one time and another one another time. Before you even enter the trade, everything is exactly mapped out: your entries, your stop loss, and your profit target. Surely as a confused trader you can see why that is infinitely more useful then the slippery double speak BS spewed forth by other “gurus.” Have you ever tried to read a post by some of the gurus explaining their methods?  It’s a bunch of doublespeak, confusion, and overly-complicated crap that doesn’t even make sense, and if you quesiton them on it, they get ultra-defensive (which is textbook scam artist behavior).

This site is the opposite of that. There’s no doublespeak. There’s no ambiguity. There’s no BS. There’s no riddles. There’s no after-the-fact excuses.

To be honest, this method would work even if you used other levels instead of the fibonacci levels, the only difference is I wanted to give fib traders some hope so for this thread I chose to use the levels they love so much.

Put another way, it has nothing to do with the Fibonacci levels.

Just Because Everyone Else Does it Doesn’t Mean It Works

I hear this a lot from Fib traders:

“Well if enough people are using Fibonacci lines then they will become a self-fulfilling prophecy and work!”

First of all, are they working for you?  No?

They’re still missing it.

If hundreds of thousands of people use it, that doesn’t mean it isn’t outside the realm of trading. “if everyone does it it must be right.” No.

If millions of people use tennis scores to trade, that doesn’t mean tennis scores are related to trading.

Fibonacci sequences are outside the realm of the financial markets.

Are they a real math thing?  Yes.

Might they exist in nature?  Sure, maybe.

Does that mean they have anything to do with trading at all?  Of course not.

Once More, Why Fibs Aren’t Related To Trading

Because you’re taking something that is definitely outside the realm of financial markets and trying to apply it to the financial markets.

It’s exactly as illogical as applying something like the progression of Tennis Scores, which are definitely outside the realm of financial markets, (0 (love), 15, 30, 40) and trying to apply that to the financial markets.

Or taking a progression of prime numbers, which are definitely outside the realm of financial markets, and trying to apply that to the financial markets.

Or taking [anything] that is outside the realm of the financial markets and trying to apply it to the financial markets.

Is the fibonacci sequence a “real thing?” Yes, absolutely. That wiki article explains it.

But is completely outside the realm of trading and that is why it makes as much sense to apply it to trading as it does to apply Tennis scores or prime numbers or anything else.

I’m not sure how else I can explain it.

I mean think about it. You’re saying that a ratio of numbers (that may or may not even be found in nature) are somehow applicable to psychology. That’s a colossal stretch.

Ratio of things in nature != psychology. That’s as absurd as saying the number of pellets in a bag of dog food can predict basketball scores.

The Golden Ratio

There is some information on Wikipedia about the Golden Ratio:

Golden Ratio

That link just explains fib numbers and has one bullet point about how some people say it indicates resistance points in the market but it’s disputed.

It doesn’t explain how or why or where the correlation from [unrelated mathmatical property] to [financial market application] comes from.

Once again, just because something exists in nature doesn’t mean it has anything to do with trading!